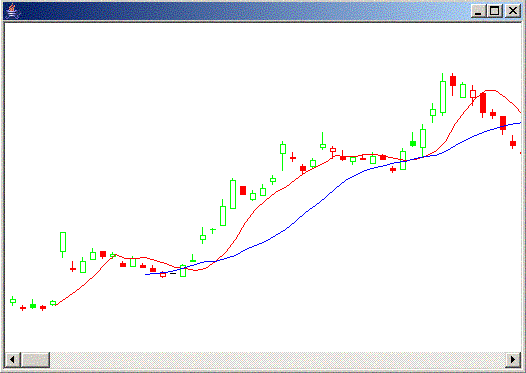
 net.sourceforge.charting.gui.ScrollPaneChartApp
  net.sourceforge.charting.gui.ScrollPaneChartApp
Version: 0.1.1
This software is made in Taiwan, thus the name TaiwanTrader. Apart from that it has little to do with Taiwan. (Of course, it can be used to analyze Taiwanstocks, just as well as any others.)
TaiwanTrader is supposed to become an extendable charting application, which displays stock data as candlesticks or bar charts. It currently provides very few indicators, but allows to add addtional ones by writing Java classes to an API (Interface IChartDrawer). At this moment a moving average is the only indicator provided with the software.
It will also allow the user to generate trade signals - also by writing additional Java classes to another API. This API is not implemented here.
The current version provides an API for developing additional indicators which write to the chart area, i.e. the area, where the stock data are displayed.
The current version (v0.1.1) contains a ScrollPane with a Canvas subclass, which allows to display stock data read from a text file as candlesticks and scroll through them horizontally, scaling appropriately as the range of data changes. The main functionality is found in the class StockChart - a subclass of Canvas. It is attached to the ScrollPane in class ScrollPaneChart. The class ScrollPaneChartApp is an application for testing the ScrollPaneChart.
This application is to be extended to a charting application, by adding functionality to load stock data for different companies, displaying and hiding some indicators and generating some simple trading signals. I do not plan to provide numerous indicators or support a wide range of trading strategies. I want to leave this either to the Java competent user or hope for other developers to help. The major focus for me will be two APIs mentioned above and - above all - a decent GUI.
The decent GUI is very important, because without it nobody will be interested to use the application, no matter how brilliant and perfect everything else works. Thus this will be a major focus.
The file NCP contains stock data for the News Corporation (Australia) in MetaStock Format, currently the only supported format. Under Windows it should be copied to the root directory of the drive with the application. The application reads the file at startup and expects it there.
>> top of pageThe ScrollPaneChart displays stock data - currently only as candlesticks. For
purposes of chart analysis indicators can be added. At this time the application
only supplies a moving average (class MovingAverage).
Other indicators can be supplied by the Java competent user.
Each user supplied indicator needs a data source where it gets the data to
be analyzed and a target where it can draw whatever it wants to indicate.
For example, the MovingAverage inidcator needs to get data to average and a chart where it can draw a line representing the moving average.
The data source is a class which implements the IChartAnalyzer interface, which provides methods to get at the data to be analyzed. The target is a class which implements the IChartDrawer interface.
The IChartAnalyzer interface provides methods to get at the data to be analyzed.
The IChartDrawer interface provides methods which allow to draw lines an
>> top of pageFiles and packages of version 0.1.1 of TaiwanTrader
Code:
(directory: net\sourceforge\charting\gui )
(directory: net\sourceforge\charting\support )
Installation/Build notes:
Unzip the file into some directory, copy the file NCP.txt into the root
directory of the drive. Then from the directory above 'net' enter:
javac net\sourceforge\charting\gui\*.java
javac net\sourceforge\charting\support\*.java
java net.sourceforge.charting.gui.ScrollPaneChartApp
That compiles everything and starts the application.